

A gap analysis template with four columns: current state, target state, the gap, and owned actions. With a worked example and the steps.
Teams say "we need to do better at onboarding" and nod, and nothing changes, because "better" was never defined and nobody owned the distance. A gap analysis is the fix for exactly that.
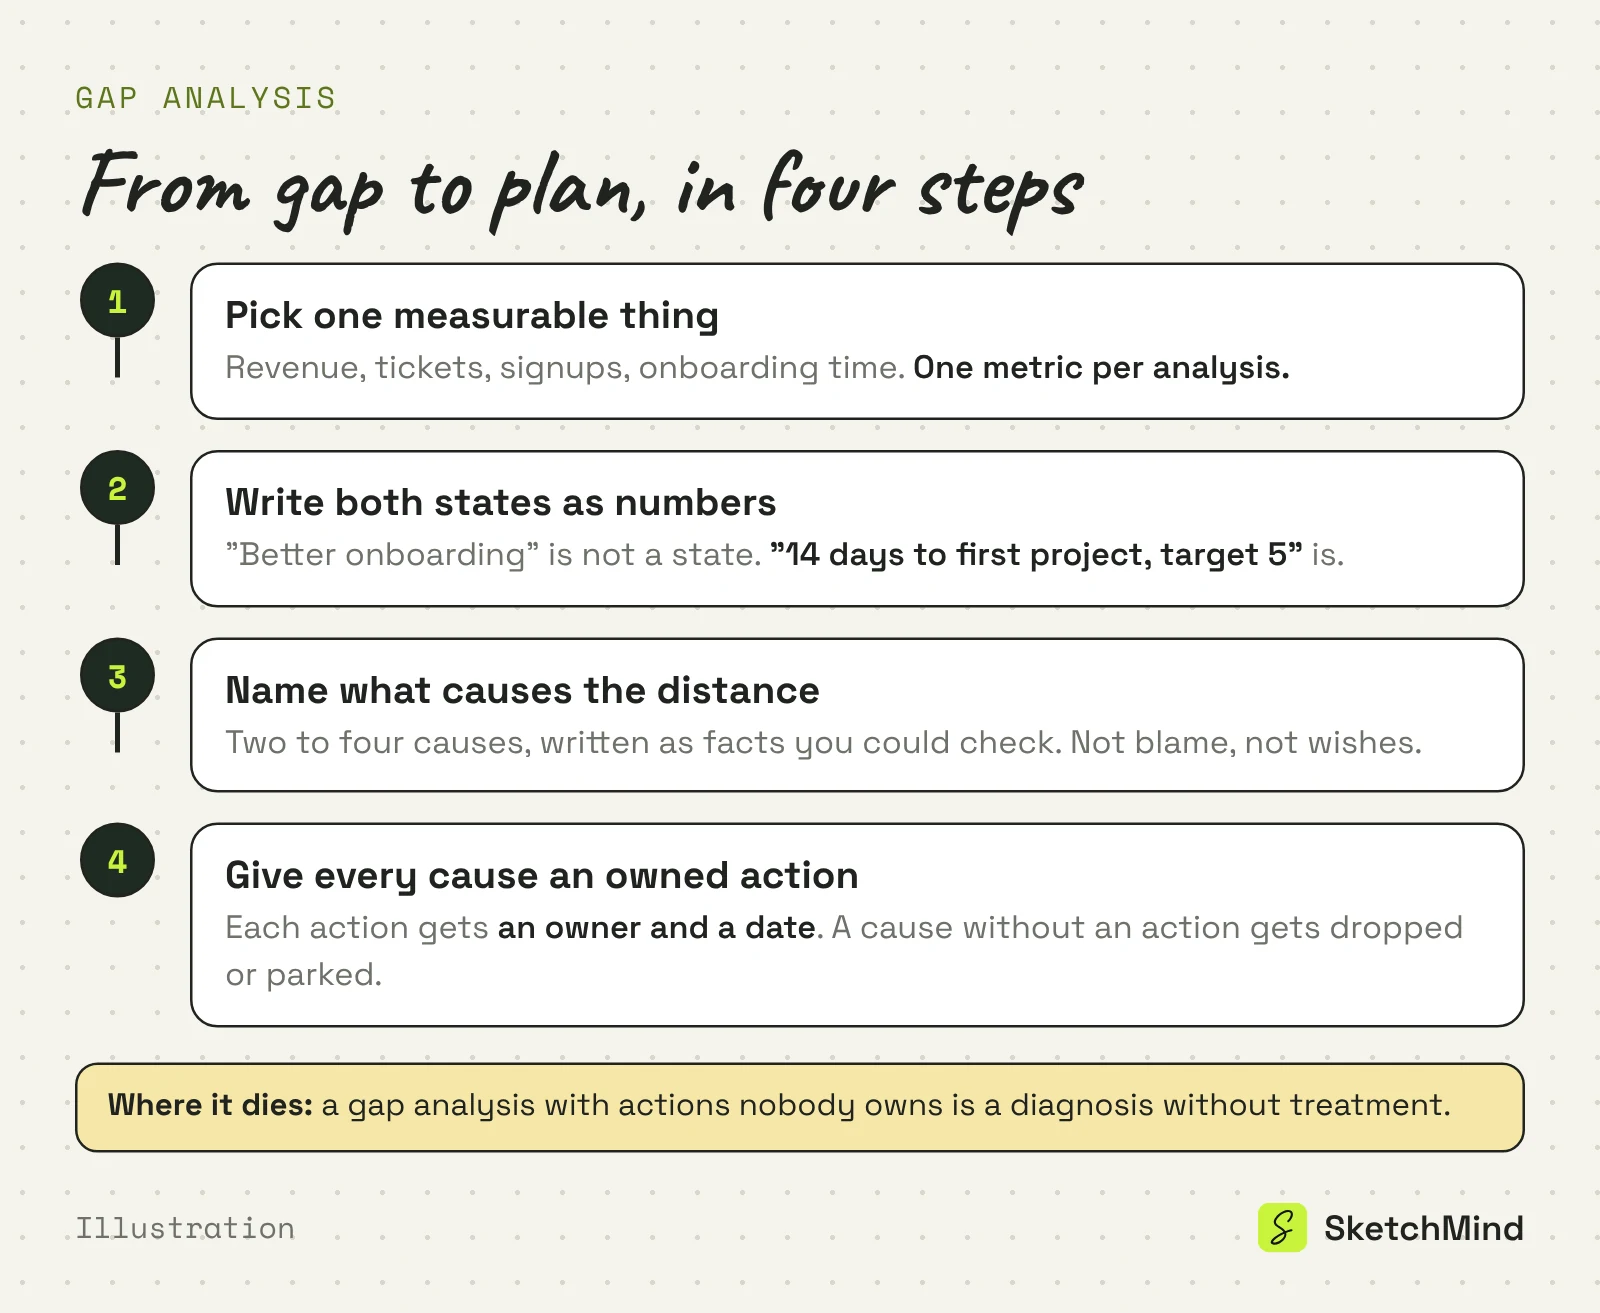
Short answer: A gap analysis template has four columns: current state, target state, the gap, and actions. You write both states as numbers, name what causes the distance between them, and give every cause an action with an owner and a date. The whole exercise fits on one board and takes under an hour for a single metric.
A gap analysis is a structured comparison between where you are now and where you want to be, used to work out what stands in between and what to do about it. It applies to almost any measurable thing: revenue, support volume, skills on a team, time to onboard a customer, compliance requirements.
The value is not the comparison itself. Everyone already senses the gap. The value is that writing both states down as numbers forces the vague worry ("support is drowning") into a checkable claim ("40 tickets a week now, 20 is sustainable"), and that the format refuses to end before someone owns each fix.
Four columns, read left to right. Most templates you find online add scoring models and maturity levels; for most teams that is decoration. The four columns are the machine.
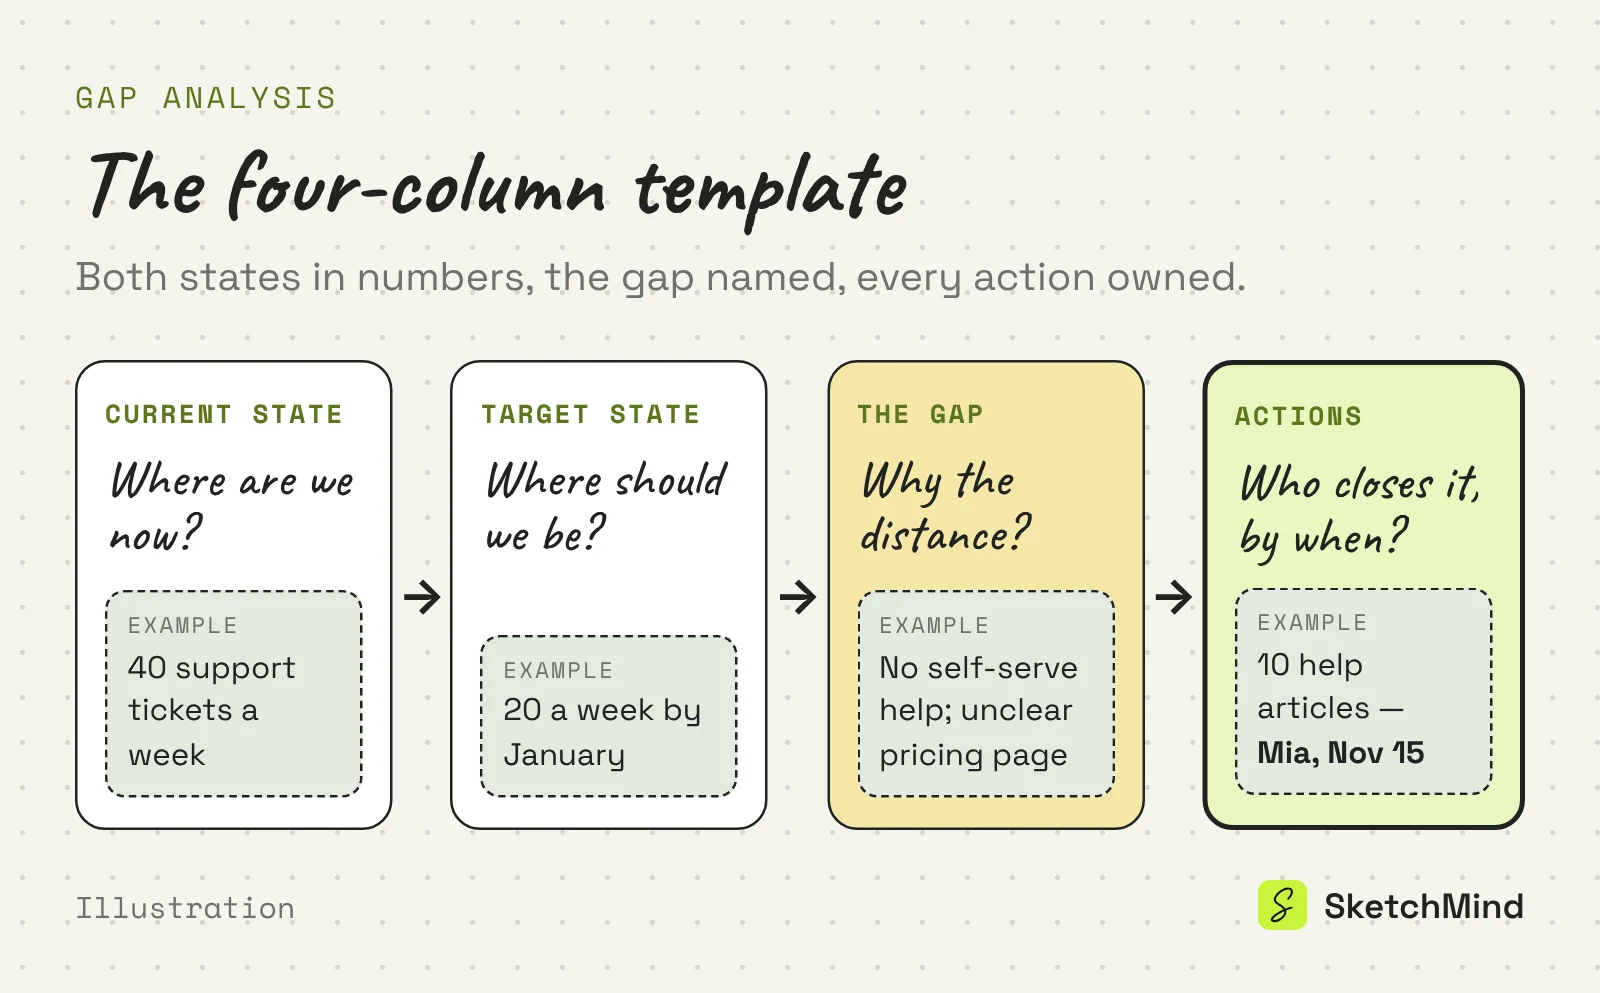
Work the columns in order and resist filling the actions column first, which is what every group wants to do.
Both are honesty exercises on one page, but they point in different directions. A SWOT analysis maps your whole position; a gap analysis measures one distance and closes it.
Two frameworks, different jobs
|Aspect|Gap analysis|SWOT analysis|
|---|---|---|
|Scope|One metric at a time|Whole position: strengths to threats|
|Input|Two numbers and their causes|Observations across four quadrants|
|Output|Owned actions closing one gap|Moves that pair strengths with opportunities|
|Best moment|A known problem needs a plan|Orientation before strategy or planning|
A practical pairing: SWOT first to find what matters, then a gap analysis on the one weakness that hurts most.
Spreadsheets hold the numbers fine but hide the thinking, and slide decks make the result look more finished than it is. A whiteboard keeps the causes arguable, which is the point of the session.
In SketchMind, an AI whiteboard, you can describe the exercise instead of drawing it: the Frames option in Create with AI turns a prompt like "gap analysis on our support ticket volume: current state, target state, causes, actions" into 4 to 8 editable frames on your board in about 40 seconds, and you fill in your own numbers. A prompt can be up to 3,000 characters and take a PDF of up to 5 MB as context, so last quarter's support report can ride along. For the follow-through there is "Make a plan from this board", which turns the board's frames into phases and steps, each step with an owner and a date on that owner's agenda. That mirrors the rule that makes the method work: an action plan is only real when every line has a name on it.
However you run it, finish the session with the actions column full and owned. A gap analysis that ends at the diagnosis just documents the problem twice.
Last updated: October 5, 2026. Checked against the current SketchMind app.
A structured comparison between where you are now and where you want to be, used to find what causes the distance and what to do about it. Both states are written as numbers, and every action gets an owner.
Current state, target state, the gap (the causes of the distance), and actions. Each action carries an owner and a date.
The same template runs on different subjects: skills gaps on a team, performance gaps against a target, market gaps against competitors, and compliance gaps against a requirement. The columns do not change.
SWOT maps your whole position in four quadrants; a gap analysis measures one distance and plans the closing of it. SWOT is orientation, gap analysis is execution.
When a specific metric is off target, and again when the actions' dates pass. It is a working tool, not a quarterly ritual.